Completion Rate
Learner
CAGR
Program Rating
Course Designed By the Industry Experts for the Future Leaders
Unlock Job Opportunities with UptopCareers' Online Big Data Analytics Course. Gain valuable job assistance and elevate your chances in the competitive field of digital marketing.
UptopCareers offers comprehensive interview preparation to help candidates with Data Analytics Certification excel and secure their dream jobs.
UptopCareers helps Data Analytics course candidates create effective CVs to maximise their opportunities in the field.
UptopCareers provides focused soft skills training, including interpersonal and communication abilities, leadership development, and more, within their Digital Marketing Program.
The Big Data course provides a thorough curriculum Including essential data analytics topics and techniques, equipping with a solid foundation in methodologies, tools, and technologies.
The course focuses on practical learning via hands-on projects, case studies, and real-world applications using popular data analytics tools and software.


Through the Online Data Analytics Course from UptopCareers, you will delve into the latest data analytics strategies, equipping yourself with cutting-edge techniques that are highly sought-after in the industry. With a focus on practical, hands-on experience, you'll have the opportunity to apply these strategies in real-world scenarios, ensuring you develop a strong skill set that can be immediately implemented in your professional endeavours.
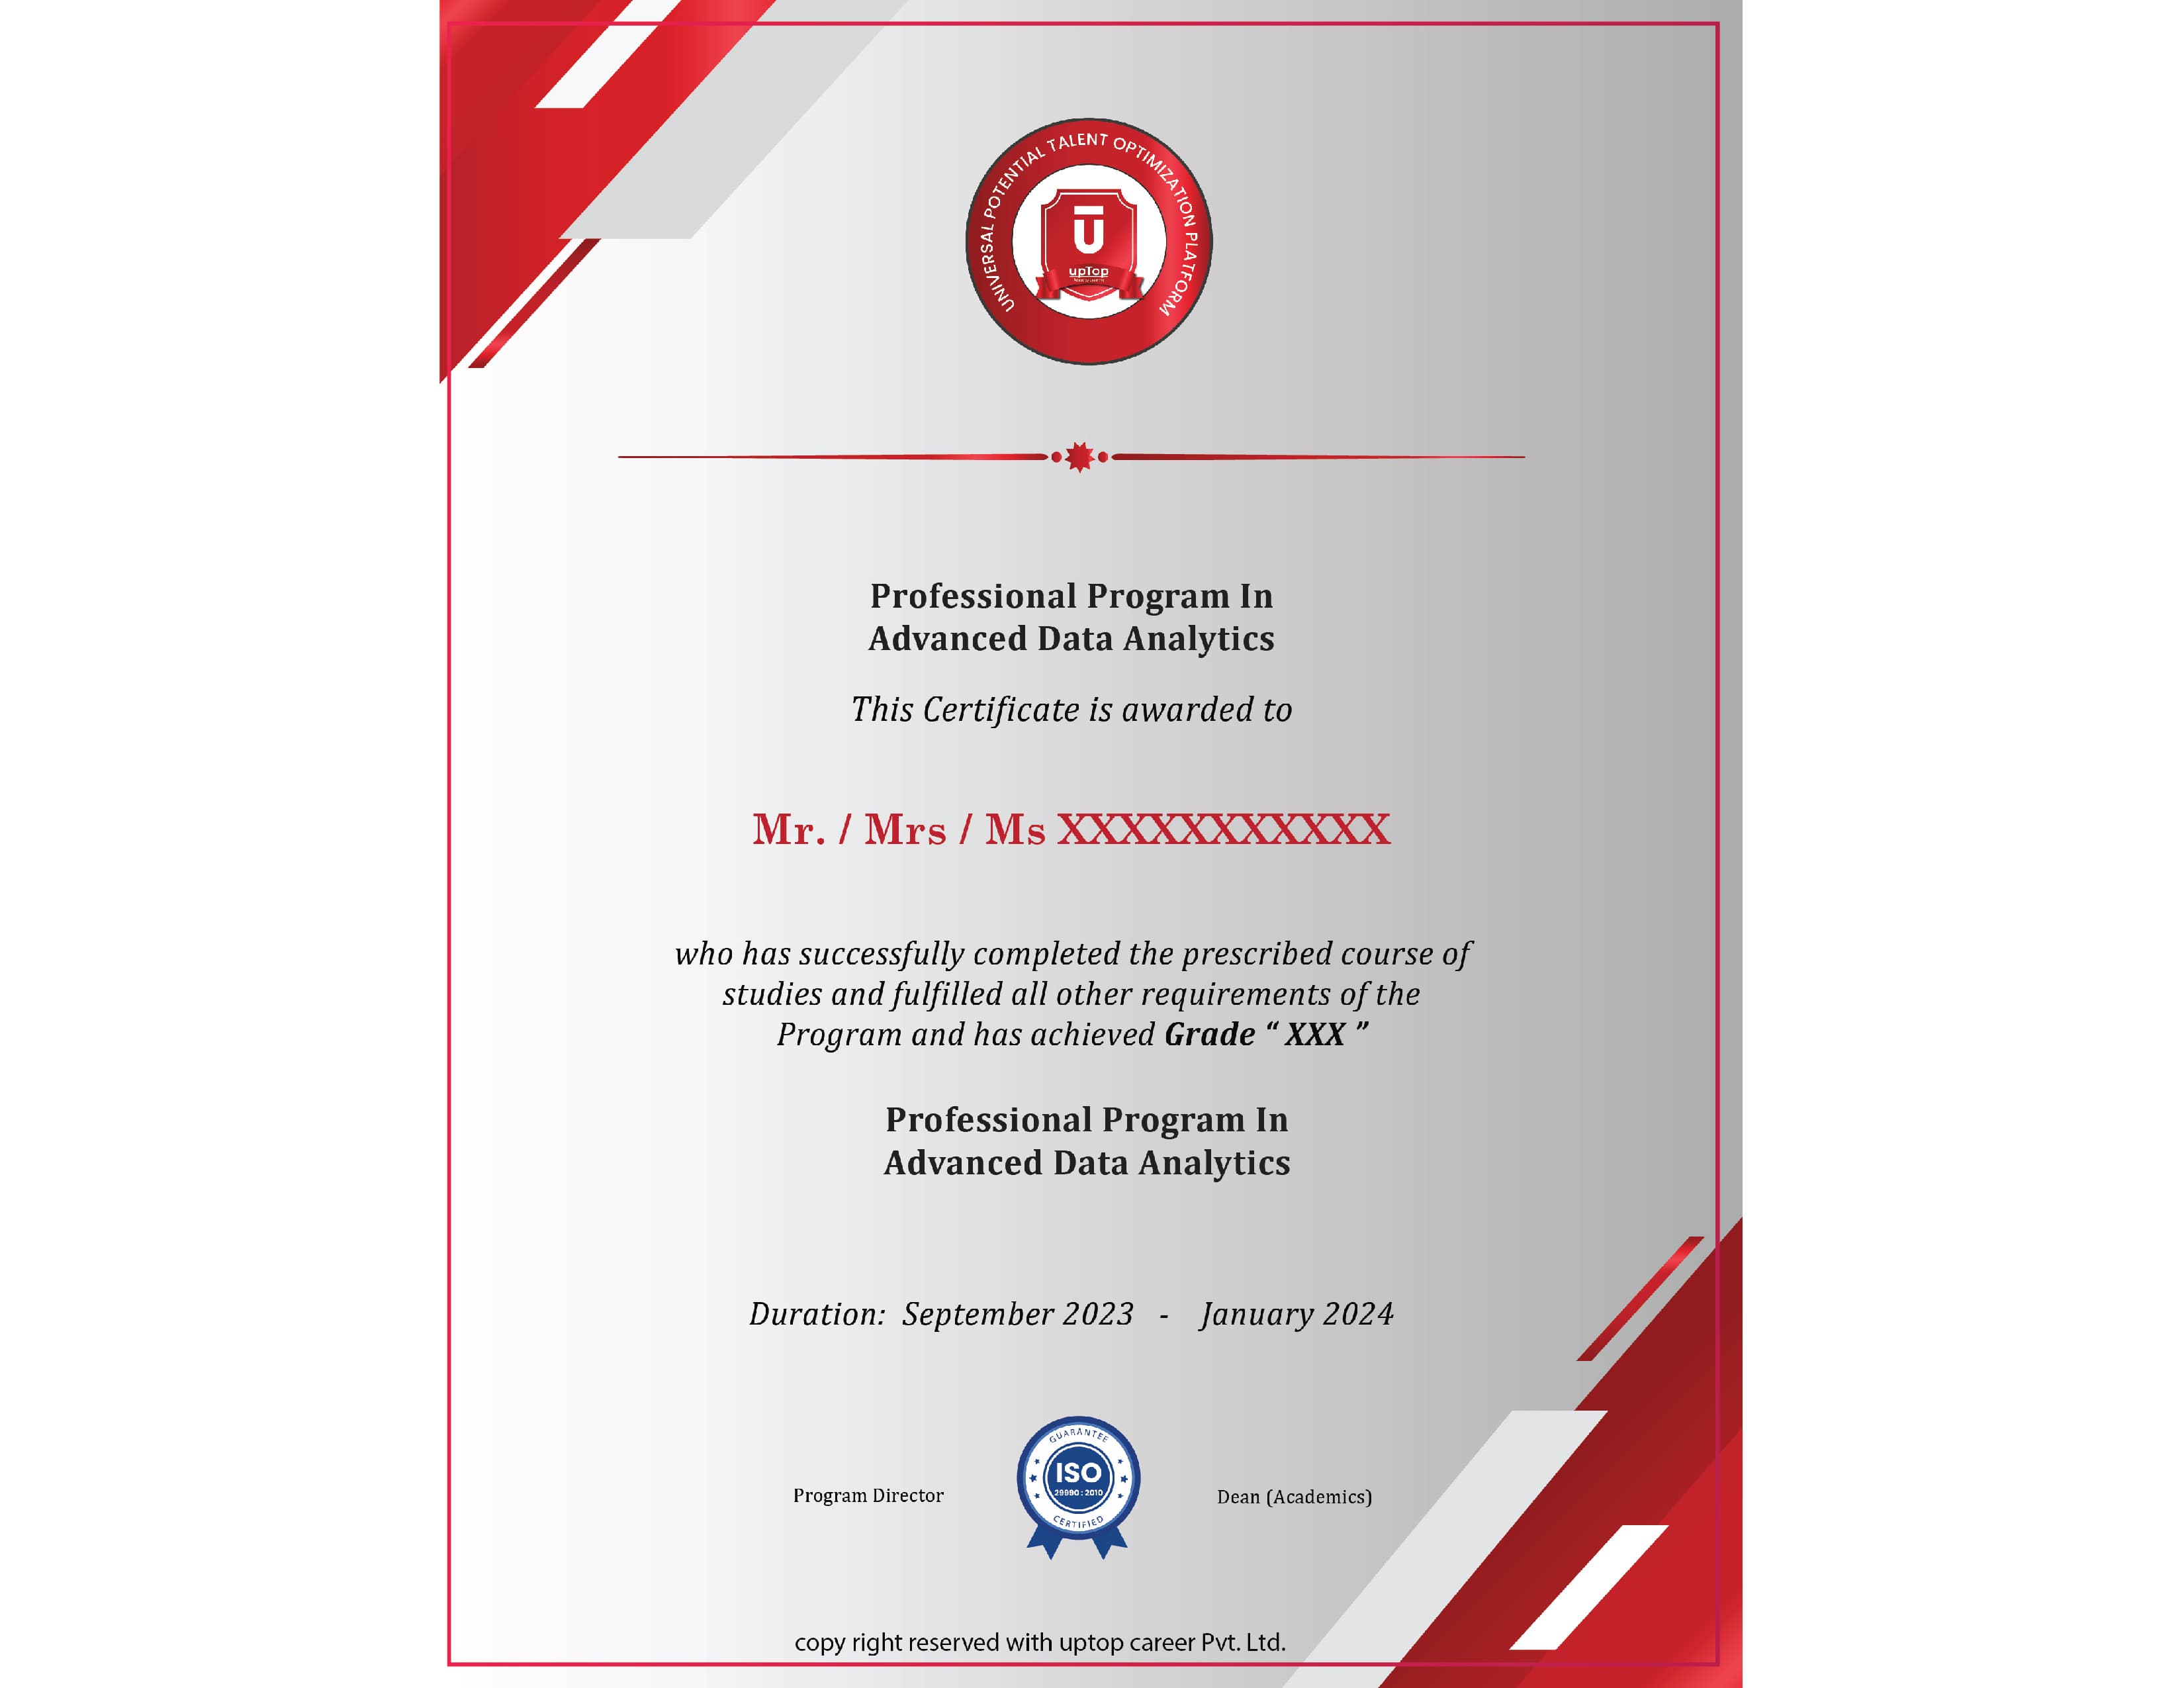
Upon successful completion of the course, participants of the Data Analytics Course will be awarded a verified certificate by Uptop Careers. Minimum attendance requirements and submission of the final project are necessary to obtain the certificate.

Participants will be advised by professional counselors over the virtual mode
Profiles will be shortlisted in view of qualification standards and counselor comments on the profile.
Shortlisted profiles will have a virtual meeting with the IIM faculty panel.
Approved participants shall receive a call letter from IIM to process further enrollment.
A participant's seat in the program gets affirmed once the enrollment process is completed.
Closes in: 5 days
UptopCareers.com is an online (ISO Certified) learning platform that offers a wide range of professional courses from top universities and institutions like IIM (Indian Institute of Management). It provides learners with access to high-quality educational content and the opportunity to earn certifications. It focuses on peer-to-peer learning, allowing students to help each other with assignments.
UptopCareers.com has come up with its own courses as digital marketing and data science to help those who cannot afford to pay high program fee with universities and top B schools. The UptopCareers.com inhouse courses are designed keeping in mind the freshers level professional learning needs.
The inhouse courses of UptopCareers.com are designed to have a well-structured and comprehensive curriculum. The curriculum may include a combination of theoretical concepts, practical exercises, case studies, projects, and assessments. It focuses on delivering a robust learning experience and ensuring learners gain a deep understanding of the subject matter and get best job they deserve.


A Data Analyst is a professional who collects, processes, and analyzes data to extract valuable insights and inform decision-making within an organization. They play a crucial role in helping businesses understand their data, identify trends, and make data-driven decisions to improve operational efficiency, optimize strategies, and drive business success. Here are some key roles and responsibilities of a Data Analyst:
1. Data Collection: Data Analysts are responsible for gathering relevant data from various sources, such as databases, spreadsheets, APIs, or external datasets. They ensure the data is accurate, complete, and properly formatted for analysis.
2. Data Cleaning and Preparation: Data often requires cleaning and preprocessing to remove errors, inconsistencies, and outliers. Data Analysts perform data cleaning tasks, such as handling missing values, standardizing data formats, and transforming data into a suitable format for analysis.
3. Data Analysis: Once the data is cleaned and prepared, Data Analysts employ various analytical techniques to uncover patterns, trends, and insights. They use statistical methods, data visualization, and data mining techniques to explore the data and identify meaningful patterns that can drive decision-making.
4. Report Generation and Data Visualization: Data Analysts create reports and dashboards to present their findings and insights to stakeholders. They use data visualization tools and techniques to effectively communicate complex data in a clear and understandable manner, enabling stakeholders to make informed decisions based on the analysis.
5. Performance Monitoring and Tracking: Data Analysts monitor and track key performance indicators (KPIs) to evaluate the success of strategies, initiatives, or campaigns. They develop tracking mechanisms, analyze data in real-time, and provide regular updates on performance metrics.
6. Data-Driven Decision-Making: Data Analysts collaborate with stakeholders, such as managers, executives, or department heads, to understand their requirements and provide data-driven insights to support decision-making. They help stakeholders understand the implications of data analysis on various business aspects and guide them in making informed choices.
7. Continuous Improvement: Data Analysts contribute to the continuous improvement of data analytics processes within an organization. They identify opportunities to enhance data quality, streamline data collection and analysis procedures, and explore new tools and techniques to stay up-to-date with advancements in the field.
Yes, data analytics is generally considered a high-paying field. The demand for skilled data analysts has been growing rapidly as businesses across various industries increasingly rely on data-driven insights to make informed decisions and gain a competitive edge.
Yes, data analytics is widely regarded as a good career choice, and it offers numerous benefits and opportunities. Here are several reasons why data analytics is considered a promising career:
1. High Demand: The demand for skilled data analysts is rapidly increasing across industries as organizations recognize the value of data-driven decision-making. Businesses need professionals who can analyze and interpret data to uncover insights that drive strategic initiatives, optimize processes, and improve business performance.
2. Growing Job Opportunities: The field of data analytics offers a wide range of job opportunities. From data analysts to data scientists, business analysts, data engineers, and more, there are diverse roles available to suit different skill sets and interests. This provides flexibility and the potential for career growth and specialization.
3. Competitive Salaries: Data analysts often receive competitive salaries due to the high demand for their skills. As organizations place greater emphasis on data-driven decision-making, they are willing to invest in qualified professionals who can effectively analyze data and provide valuable insights.
4. Continuous Learning and Development: Data analytics is a dynamic field that constantly evolves with advancements in technology, methodologies, and tools. This offers opportunities for continuous learning and development, ensuring that professionals in this field can stay relevant and expand their skill sets over time.
Yes, it is possible for a fresher, or someone with little to no professional experience, to become a data analyst. While some employers may prefer candidates with prior experience, there are several pathways for freshers to enter the field of data analytics.
The average salary of a Data Analyst can vary depending on factors such as experience, location, industry, and the organization itself. Here are some estimates of the average salaries for Data Analysts in India and abroad:
India:
1. Entry-level Data Analyst: The average salary for entry-level Data Analysts in India typically ranges from INR 3-6 lakhs per year (approximately USD 4,000-8,000).
2. Mid-level Data Analyst: With a few years of experience, mid-level Data Analysts in India can earn an average salary of INR 6-12 lakhs per year (approximately USD 8,000-16,000).
3. Senior Data Analyst: Senior Data Analysts with significant experience and expertise can earn an average salary of INR 12-20 lakhs per year (approximately USD 16,000-26,000) or more.
Abroad:
1. United States: The average salary for Data Analysts in the United States ranges from USD 60,000 to USD 90,000 per year. This can vary based on location, experience, and the specific industry.
2. United Kingdom: In the United Kingdom, Data Analysts can earn an average salary ranging from GBP 25,000 to GBP 50,000 per year, depending on experience and location.
3. Australia: Data Analyst salaries in Australia typically range from AUD 60,000 to AUD 100,000 per year, with variations based on experience, location, and industry.
4. Canada: Data Analysts in Canada can earn an average salary ranging from CAD 50,000 to CAD 80,000 per year, depending on experience, location, and industry.
You can start your data analytics learning journey by enrolling in the flexible and convenient Online Data Analytics Certification course offered by UptopCareers. This online course is designed to accommodate your schedule, with virtual classes conducted on weekends, making it accessible to working professionals and students alike. To join the course and unlock a world of data analytics knowledge and skills, simply follow the straightforward enrollment process provided by UptopCareers.
Yes, the Big Data Analytics Certification course from UptopCareers can be a valuable starting point for launching your career as a Data Analyst. This Data Science Online Course is designed to equip you with the necessary knowledge, skills, and practical experience to excel in the field of data analytics. This Data Science course will provide you with several career opportunities in this field along with data analytics. Here are some potential career paths along with data analytics you can consider:
1. Data Analyst
2. Business Analyst
3. Data Scientist
4. Data Engineer
5. Data Visualization Specialist
6. Market Research Analyst
7. Consultant or Freelancer